The Same AI Agent Ships 79% of Its Code at Top Teams and 37% at Average Ones. The Tool Is Not the Variable.
In LinearB's 2026 benchmark, autonomous AI agents got 79% of their pull requests merged at elite teams and just 37% at average ones. Same agents, less than half the yield. The number that moves is not the tool. It is everything the tool cannot see. Here is why AI coding output is not a fixed quantity, and what actually decides how much of it ships.
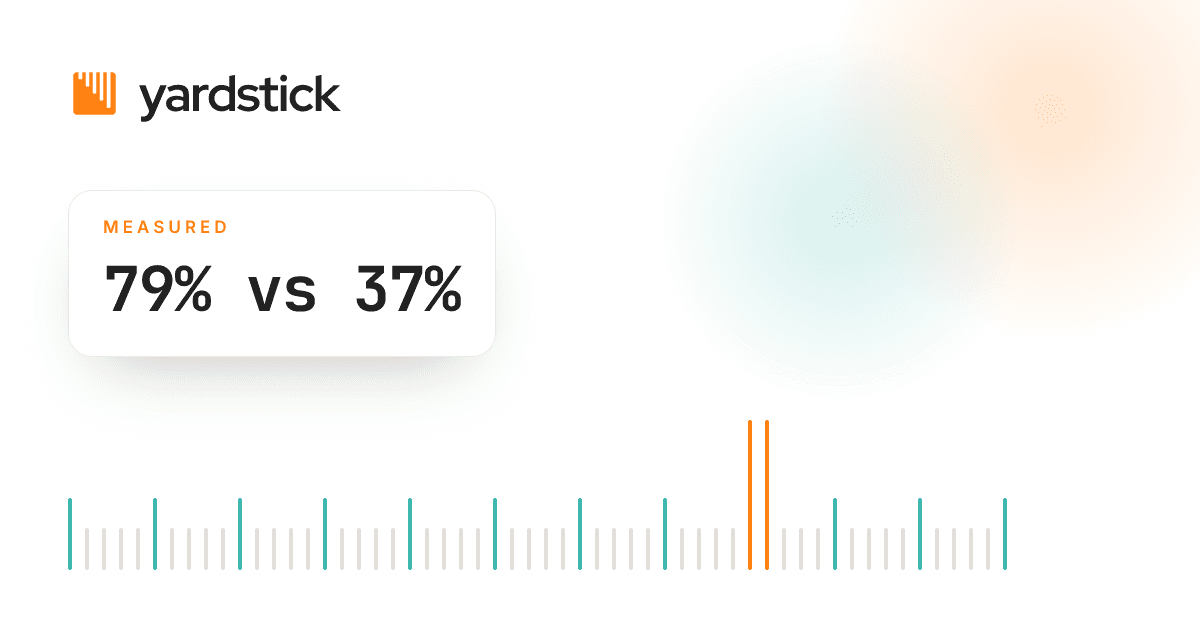
Give two engineering teams the same autonomous AI coding agent. At the best teams, 79% of the pull requests that agent opens get merged. At average teams, that number falls to 37%.
Same agent. Same model. Less than half the yield.
That gap is from LinearB's 2026 benchmark, which looked at 2.7 million pull requests across 83,000 developers and 253 organizations between February and May 2026. And it is the most important thing anyone has published about AI coding this year, because it says the tool is not the thing that decides what you get out of AI. Something else is, and that something is measurable.

What Yield Actually Measures
Yield here is simple: of the pull requests that get opened, how many actually merge and ship, rather than getting abandoned, rewritten, or left to rot. It is the share of produced work that turns into kept work.
It matters because volume alone is a lie. An AI agent that opens a hundred PRs looks productive. If only thirty-seven of them merge, you paid for a hundred and shipped thirty-seven, and the rest was tokens spent on work nobody kept. A different team running the identical agent opens a hundred, merges seventy-nine, and got more than double the shipped output from the same spend.
The pricing page charges both teams the same. The agent behaves the same. The invoice per merged PR is more than twice as high for the second team, and nothing about the tool tells you which team you are.
Pro Tip: Before you judge an AI coding tool by how much code it produces, find out how much of that code actually merged. Volume produced and volume shipped are different numbers, and only the second one is worth paying for.
Why the Same Agent Yields So Differently
Because the agent only does one part of the job. Everything that turns its output into shipped code happens outside the agent, and that is exactly where teams differ.
A strong team has tight, well-scoped tasks, a clean codebase the agent can navigate, a review process that can actually handle the volume, and clear conventions the output can follow. Feed an agent into that and most of what it produces is close enough to merge. A weaker setup has vague tickets, a messy codebase, a review queue that was already stretched before AI doubled the PR count, and no shared conventions. Feed the identical agent into that and most of what it produces needs so much correction that it stalls or gets abandoned.
The agent is a constant. The environment is the variable. That is why the same model can be a 79% agent at one company and a 37% agent at another. You are not really measuring the tool when you measure yield. You are measuring how ready your organization was to absorb what the tool produces.
Why the Number That Rises Is Not the Number That Matters
Here is the trap the benchmark exposes. Among heavy AI users, merge counts went up sharply, as much as 2.3 times. At the same time, yield among those same developers slipped year over year. More PRs merged in absolute terms, and a slightly smaller share of what was opened made it through.
So the visible number went up and the quality of the output went down at once, and if you were only watching the visible number you would have called it a clean win. Merges are up. Ship it to the board. The slip in yield does not show up on a volume dashboard, because a volume dashboard counts what merged and never counts what was opened and thrown away.
This is the same shape as every other AI measurement problem. The easy number is the flattering one. Merges rose, so AI is working. The number that would complicate the story, how much you spent to get those merges and how much you spent on PRs that never merged, is the one nobody is looking at, because it has to be built rather than read off a screen.

What Separates a 79% Team From a 37% Team
The benchmark does not just show the gap, it points at what closes it. The teams at the top of the yield distribution were not running secret tools. They were running the same tools inside a setup that could absorb the output.
The Four Things the Agent Cannot See
- Task scope · Well-defined, appropriately sized tasks produce output that is close to mergeable. Vague or oversized tasks produce output that needs heavy rework, which is where yield goes to die.
- Codebase readiness · A clean, consistent, well-documented codebase lets the agent produce code that fits. A tangled legacy codebase forces so much correction that much of the output never lands.
- Review capacity · AI raises the number of PRs. If review capacity does not rise with it, PRs pile up, go stale, and the yield drops regardless of how good the code was.
- Shared conventions · When the output can follow clear team conventions, it merges. When there are none, every PR becomes a negotiation, and negotiations are where AI PRs stall.
None of these are things you buy from a vendor. They are things you measure and improve, and you can only improve them if you can see your yield in the first place.
Volume Versus Yield: What Each One Tells You
| Volume | Yield | |
|---|---|---|
| What it counts | PRs merged | Share of opened PRs that merge |
| Easy to read off a dashboard | Yes | No, it has to be built |
| Rises when you adopt AI | Almost always | Only if the setup can absorb it |
| Tells you the tool is busy | Yes | No |
| Tells you the spend produced value | No | Yes |
| Where the 79 vs 37 gap shows up | Hidden | Right here |
Both teams in the benchmark could point to more merged PRs after AI. Only the yield number told them whether they were the 79 or the 37.
Key Takeaways
- AI coding output is not a fixed quantity of value. In LinearB's 2026 benchmark, the same autonomous agents yielded 79% merged PRs at elite teams and 37% at average ones. The tool was identical.
- The variable is everything the tool cannot see. Task scope, codebase readiness, review capacity, and shared conventions decide how much of the agent's output actually ships. The agent is a constant, the environment is the variable.
- Volume is a flattering lie. Merge counts rose as much as 2.3 times among heavy AI users while yield slipped. More PRs merged, a smaller share of opened PRs made it, and only the first number shows on a volume dashboard.
- Yield is what maps to spend. A 37% team pays more than twice as much per merged PR as a 79% team running the same agent. Cost per merged PR is where that gap becomes visible.
- The fix is not a better tool, it is a measured environment. You close the yield gap by improving scope, codebase, review capacity, and conventions, and you can only improve what you can see.
Why Teams Keep Buying Tools to Fix an Environment Problem
The instinct when AI is not delivering is to question the tool. It is the visible thing, it has a name and a price and a competitor, and switching it feels like decisive action. The benchmark suggests that instinct is usually wrong. If the same agent yields 79% in one shop and 37% in another, the tool is not the thing holding the 37% team back. Swapping it for a different agent moves them from one 37% to another.
The pattern I keep running into is a team that has changed AI coding tools twice looking for the productivity they were promised, when their actual problem is a review queue that cannot keep up and a codebase the agent cannot navigate cleanly. No tool fixes those. A different logo on the same broken pipeline yields the same disappointing number, and the team concludes AI does not work for them, when what did not work was feeding a lot of AI output into an environment that could not absorb it.
The teams that get the 79% are not the ones with the best tool. They are the ones who measured where their output was leaking, saw that most of the loss was in review and rework rather than in the model, and fixed the part they could actually fix. That is a less exciting answer than a new tool, and it is the one the data keeps pointing at.
The tool sets the ceiling. Your environment decides how close to it you get. Only one of those shows up on the pricing page, and it is not the one that decided your yield.
· Vukasin
How Yardstick Shows You Your Real Yield
Yardstick joins AI coding spend to merged outcomes from your Git provider and shows cost per merged PR by tool and by team, updated daily. Because it counts both what was opened and what actually shipped, it surfaces the yield number that a volume dashboard hides, so you can see whether you are closer to the 79 or the 37.
With attribution at the PR level, Yardstick shows where yield is leaking: task types with high abandonment, review stages where AI PRs stall, and areas of the codebase where correction rates spike. That is the map of the environment problem the benchmark says is the real variable.
For teams tempted to switch tools to chase productivity, Yardstick answers the prior question first: is the tool your ceiling, or is your environment the reason you are nowhere near it? The cost per merged PR number tells you which, before you spend a quarter migrating to the same result.
To see the platform or join the early access list, visit yardstick.fi/platform or review pricing for current plan options.
FAQ
What is PR yield and why does it matter for AI coding?
PR yield is the share of opened pull requests that actually merge and ship, rather than being abandoned or reworked away. It matters because AI agents can produce large volumes of PRs, and volume alone does not indicate value. If an agent opens a hundred PRs and only thirty-seven merge, you paid for a hundred and shipped thirty-seven. Yield is the number that connects AI output to actual delivered work.
Why does the same AI coding agent perform so differently across teams?
Because the agent only handles part of the work, and everything that converts its output into shipped code happens in the surrounding environment. Task scope, codebase cleanliness, review capacity, and shared conventions all determine how much of the agent's output can merge. In LinearB's 2026 benchmark, the same autonomous agents yielded 79% merged PRs at elite teams and 37% at average teams, because those environmental factors differed, not the tool.
Does higher AI merge volume mean higher productivity?
Not on its own. In the benchmark, merge counts among heavy AI users rose as much as 2.3 times while PR yield slipped year over year. More PRs merged in absolute terms, but a smaller share of what was opened made it through. Volume dashboards count what merged and never count what was opened and discarded, so they can show a clean rise while the quality of output declines.
Should we switch AI coding tools if we are not seeing results?
Usually the tool is not the limiting factor. If the same agent yields 79% at strong teams and 37% at weaker ones, the difference is the environment, not the model, and switching tools moves a 37% team to a different 37%. The higher-leverage move is to measure where yield is leaking, typically in review capacity and rework, and fix that before migrating tools.
How do you measure AI coding yield?
Track both the PRs an AI agent opens and the share that actually merge, then join that to spend to get cost per merged PR. Segmenting by task type, review stage, and area of the codebase shows where yield leaks. This requires attribution at the PR level rather than a monthly volume total, because a volume total cannot distinguish work that shipped from work that was produced and abandoned.
Recommended

Leads commercial and go-to-market. Founder of Emberwood, an AI-driven cold-email agency for B2B, with a background in outbound, lead generation, and sales.