How to measure ROI on AI coding agents like Claude Code and Cursor
Most engineering teams cannot answer the CFO question: what value are we actually getting from Claude Code, Cursor, and GitHub Copilot? Here is a measurement framework that produces numbers finance can verify.
Most engineering leaders cannot answer their CFO's question: what value is Claude Code, Cursor, or GitHub Copilot actually delivering? They have invoices ranging from $19 to $400 per seat per month, and usage dashboards showing tokens burned, but no clean line connecting that spend to business results. The measurement gap is not a tooling problem. It is a framing problem.
AI coding agents are now present in a majority of engineering teams running production software. Spending on AI developer tools crossed $12 billion globally in 2025, and the number is growing faster than the teams buying these tools can justify the expense. The pressure to show ROI has moved from a nice-to-have to a board-level requirement.
The good news is that measuring AI coding agent ROI is tractable. It requires three inputs: a baseline, a measurement framework that covers both costs and outcomes, and a consistent cadence for reviewing results. Here is what works, what fails, and how to think about it.

Why most AI coding agent ROI calculations are wrong
The most common mistake is measuring the wrong thing. Teams track "time saved per developer" using self-reported surveys, multiply by an hourly rate, and call it ROI. This produces impressive spreadsheet numbers that finance cannot verify, because the denominator (developer time) is not a line item in the P&L.
Real ROI measures what changes in the business when AI agents are running, compared to the baseline without them. That means:
- Pull requests merged per week: the volume of work actually shipped.
- Lead time from commit to deploy: how fast work moves through the pipeline.
- Cost per merged PR: the total spend (AI tool licensing, compute, and engineering time) divided by shipped output.
- Defect rate on AI-assisted code: whether quality holds as throughput increases.
- Adoption depth: what share of the team's actual working hours flow through the agent, not just who has a license.
The difference between surveyed time savings and actual throughput changes is large. Teams that measure throughput directly report 20 to 40% gains in merged PR volume. Teams that rely on self-reported time savings claim 30 to 60% gains that rarely show up in shipping velocity.
Pro Tip: Before you run an ROI calculation, confirm that your baseline period uses the same measurement method you will apply post-deployment. Inconsistent measurement is the single most common source of false positives in AI evaluation.
What metrics actually capture AI coding agent value?
The right metric set has three tiers, each answering a different question for a different stakeholder.
Tier 1: Volume and velocity (for engineering leads)
- Merged PRs per engineer per week
- Lead time from first commit to deploy
- Review cycle count per PR
- Agent-assisted code share (percentage of commits that touched AI-generated code)
Tier 2: Quality (for platform and QA leads)
- Defect introduction rate on AI-assisted code vs. non-AI code
- Revert rate on agent-generated commits
- Test coverage delta when AI writes tests
Tier 3: Economics (for CFOs and VPs of Engineering)
- Cost per merged PR: tool cost divided by shipped output
- Revenue per engineer, if you can tie shipped features to revenue
- Payback period: how many months of productivity gain cover the licensing cost
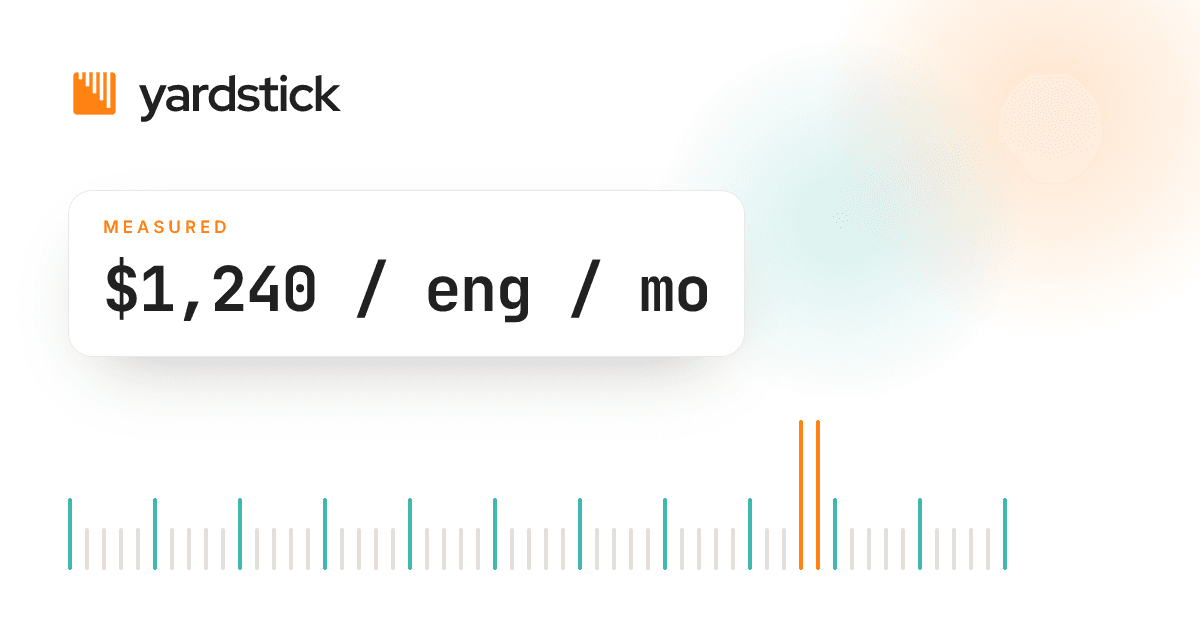
The tier-3 metrics are the ones that survive a board meeting. A CFO who sees "$1,240 in monthly productivity value per engineer against $40 in monthly AI tooling cost" has a number they can work with. A CFO who sees "developers say they save 2 hours per day" does not.
Pro Tip: Assign ownership of the tier-3 metrics to a named person on the finance team, not the AI vendor or the team using the tool. Vendor-owned metrics have a structural incentive to look good.
How to set a baseline before deploying AI coding agents
Baseline measurement is the step most teams skip. They deploy the agent, run it for 60 days, look at output numbers, and compare them to a vague memory of what shipped before. The comparison fails because the pre-deployment period was never formally measured.
A proper baseline requires:
- Choose your metrics before you choose your tools. Decide on merged PRs per week, lead time, and cost per PR before any agent is turned on. The metrics should be derivable from your existing version control and CI data.
- Run a baseline measurement period of 6 to 8 weeks. Use the same data sources you will use post-deployment. If you are pulling PR data from GitHub, pull baseline data from GitHub, not from Jira or a survey.
- Segment your team correctly. If you are rolling out to a subset of engineers, identify the control group now. A control group makes every subsequent comparison credible.
- Record the cost side. Document the fully loaded cost per engineer per month, including salary allocations, tool subscriptions, and compute. This is the denominator in your cost-per-PR calculation.
- Fix the measurement window. Decide upfront whether you will evaluate at 30, 60, or 90 days. Write it down. Changing the window after results come in is a form of p-hacking.
AI Coding Agent ROI Framework
- Baseline -- measure merged PR volume, lead time, and cost per engineer for 6 to 8 weeks before deployment.
- Deploy and measure -- run the agent with the same measurement instruments active from day one.
- Control group -- keep a holdout of engineers not using the agent for a clean comparison.
- Checkpoint at 30, 60, and 90 days -- review leading indicators at 30 days, KPI deltas at 60, full economic verdict at 90.
- CFO report -- translate KPI deltas into dollar impact using pre-agreed unit economics.
How to calculate cost per merged PR for Claude Code, Cursor, and GitHub Copilot
Cost per merged PR is the single most useful metric for comparing AI coding agents. It takes the total spend on a tool and divides it by the work that agent actually shipped. Lower is better, but only if quality holds.
The formula:
Cost per merged PR = (Monthly tool cost + compute cost + eng time attributed to AI workflow) / Merged PRs in the month
In practice, the formula simplifies to three inputs:
- Tool licensing cost: $19 to $400 per seat per month depending on the plan and vendor.
- Compute pass-through: some tools charge separately for model calls; others bundle it. Claude Code on the Pro plan bundles compute. Cursor Pro bundles a request quota and charges overages.
- Engineering time in the AI workflow: the hours engineers spend reviewing, editing, and accepting AI suggestions. A rough rule is 20 to 30% of the agent output time, but measure it directly if you can.
A team paying $40 per seat per month for Claude Code and shipping 18 PRs per engineer per month has a tool-only cost per PR of roughly $2.22. When you add the overhead of engineering time in the AI workflow, the realistic cost per PR lands between $3 and $5 for most teams in Yardstick pilot data.

The more valuable comparison is before vs. after. If a team was shipping 12 PRs per engineer per month before AI agents and 18 after, and total per-engineer tooling cost rose from $0 to $40, the cost per PR dropped from roughly $283 to $200 (assuming $3,400 fully loaded monthly cost per engineer). That is a 29% reduction in cost per unit of output. That number you can put in front of a CFO.
What is a realistic ROI for AI coding agents in 2025?
The honest answer is: it varies significantly by team context, and most published benchmarks are optimistic.
GitHub's 2023 Copilot study reported 55% faster task completion on isolated coding exercises. McKinsey reported 20 to 45% productivity improvements in structured pilots. Yardstick data from teams with continuous 90-day measurement shows 20 to 40% increases in merged PR volume, with the wide range driven by adoption depth and code review process maturity.
What drives the variance:
- Adoption depth: teams where fewer than 50% of commits touch AI-generated code see smaller throughput gains. The tool is licensed but not embedded in the workflow.
- PR size discipline: teams that break work into smaller PRs benefit more from AI agents than teams that batch large changes. AI works better on bounded tasks.
- Code review speed: if review is the bottleneck, AI on the write side does not move the needle. Faster writing into a slow review queue does not reduce lead time.
- Codebase maturity: agents perform better on green-field code and established patterns. Large legacy codebases with poor test coverage produce more AI suggestions that require human correction.
The $1,240 per engineer per month figure represents the value generated in the median measured team after 90 days, not a guarantee. Teams at the high end of adoption depth and PR discipline see higher. Teams with weak baselines or slow review processes see lower.
How to avoid the three most common AI ROI measurement mistakes
Most AI ROI calculations fail for one of three reasons.
Mistake 1: Measuring activity, not outcomes. Counting tokens consumed, AI suggestions accepted, or hours logged in a tool dashboard measures engagement, not value. Engagement does not answer the CFO question. Merged PRs, resolved incidents, and lead time reductions do.
Mistake 2: Skipping the holdout group. Without a control group, you cannot separate AI impact from a parallel sprint that happened to go well, a senior engineer joining the team, or a codebase that got cleaner in the same period. Holdout groups are inconvenient. They are also the only credible path to an auditable ROI number.
Mistake 3: Declaring victory at day 30. Leading indicators at 30 days often look better than outcomes at 90 days. Engineers are enthusiastic, PR volume spikes, and everyone is paying attention. By 90 days, the novelty effect fades and you see the real steady-state throughput change. A 90-day measurement window is the minimum for a credible AI ROI claim.
Pro Tip: If your AI vendor is providing the ROI numbers, ask for the raw data: merged PR counts, lead times, and cost figures from your own systems. Vendor-generated ROI studies have a structural bias toward positive results.
Key Takeaways
Measuring the ROI of AI coding agents is straightforward when you treat it as a measurement problem, not a tooling problem.
- Measure throughput, not sentiment. Merged PRs, lead time, and cost per PR are verifiable. Self-reported time savings are not.
- Set the baseline before deployment. Six to eight weeks of pre-deployment data using the same measurement instruments is the minimum.
- Use a control group. Even a small holdout group makes your ROI number auditable.
- Evaluate at 90 days, not 30. Novelty effects inflate early results. Steady-state changes at 90 days are what you can take to finance.
- Calculate cost per merged PR. It collapses the complexity of tool cost, compute, and eng time into one number finance can verify.
- $1,240 per engineer per month is the median value generated in measured teams at 90 days. Your number will vary based on adoption depth, PR discipline, and team structure.
Why most AI ROI evaluations fail before deployment
The pattern I see most often is teams treating AI coding agent adoption as a technology rollout, not a measurement problem. They buy the tool, announce it to the team, and wait for the results to appear on someone's slide deck. The results are always positive on the slide deck, because no one defined in advance what "positive" looked like.
The real failure mode is not measuring badly. It is not deciding upfront what you are actually trying to change. A team that deploys Claude Code to increase throughput has a different measurement problem than a team that deploys it to reduce PR review cycles or improve test coverage. The metrics are different, the baselines are different, and the 90-day verdict will be different. Treating all three as "AI coding productivity" is how you end up with numbers that are technically true and operationally useless.
The CFO question is the real test: what changes in the P&L if this tool works? If the team cannot answer that question before deployment, the post-deployment ROI study is theater. The technology may be doing something real. The measurement is not capturing it.
Engineering leaders who close this gap consistently are the ones who run AI tooling decisions the way they run infrastructure decisions: with a named metric, a baseline period, a decision rule, and a named owner. The ones who treat it as a culture change or a developer experience question end up presenting engagement metrics to a board that wants dollar figures.
- Vukasin
How Yardstick measures ROI across AI coding agents
Yardstick connects AI coding agent activity to business outcomes that finance can verify. The platform ingests data from Claude Code, Cursor, and GitHub Copilot, calculates cost per merged PR automatically using your tool licensing data and CI output, and tracks throughput and lead time in a unified dashboard.
The Yardstick Observe suite gives engineering leads a real-time view of merged PR volume, lead time, and agent-assisted code share. The Treasury suite tracks AI tool spend across vendors, surfaces cost anomalies, and generates audit-ready reports for finance. For teams running multi-agent environments with Claude Code, Cursor, and GitHub Copilot in parallel, the Yardstick compare tool shows side-by-side cost per PR and throughput numbers for each agent so teams can route work to the most cost-effective option.
Pilots typically run 90 days and produce a scorecard that translates KPI deltas into dollar impact. To see the platform or request a pilot scorecard for your team, visit yardstick.fi/platform or review pricing for current plan options.
FAQ
What is the best metric for measuring AI coding agent ROI?
Cost per merged PR is the most actionable single metric because it connects tool spend directly to shipped output. It accounts for licensing cost, compute, and engineering time in the AI workflow, and it is verifiable from your version control and billing data.
How long should an AI coding agent pilot run before evaluating ROI?
A minimum of 90 days with structured checkpoints at 30, 60, and 90 days. The first 30 days often show a novelty-effect spike in productivity. By 90 days you see the steady-state throughput change, which is the number that matters for budgeting decisions.
What is a realistic ROI for Claude Code, Cursor, or GitHub Copilot?
Yardstick pilot data shows 20 to 40% increases in merged PR volume at 90 days in teams with high adoption depth. In dollar terms, the median measured team generates $1,240 per engineer per month in throughput value against $40 per seat per month in tool cost.
Why do AI coding agent ROI studies often conflict with each other?
Most published ROI studies use different baselines, different metrics, and different measurement windows. Some measure self-reported time savings, others measure throughput, and others measure isolated task completion rather than real production workflows. Studies funded by AI vendors also carry a structural bias toward positive results.
How do you calculate cost per merged PR for AI coding tools?
Divide total monthly AI tooling cost (licensing plus compute plus estimated eng time in the AI workflow) by the number of merged PRs in the same month. If your team pays $40 per seat per month and ships 18 PRs per engineer, the tool-only cost per PR is $2.22. Add eng time overhead and the realistic figure is $3 to $5 per PR for most teams.
Recommended

Leads commercial and go-to-market. Founder of Emberwood, an AI-driven cold-email agency for B2B, with a background in outbound, lead generation, and sales.