GitHub Copilot vs Cursor vs Claude Code: which delivers the lowest cost per merged PR?
Most AI coding tool comparisons measure the wrong thing. Here is what the numbers look like when you compare GitHub Copilot, Cursor, and Claude Code on cost per merged PR at 90 days.
Most comparisons between AI coding tools focus on the wrong things. Autocomplete speed. Context window size. Which one writes better tests. These are real differences, but they are not the differences that matter when you are explaining a $50,000 annual AI tooling budget to your CFO.
The question that matters is: for every dollar you spend on AI coding tools, how much shipped output do you get back? Cost per merged PR is the metric that answers it.
This post does one thing: compare GitHub Copilot, Cursor Pro, and Claude Code on cost per merged PR at 90 days, using the same measurement framework across all three. The numbers come from Yardstick pilot data across engineering teams that ran structured deployments of each tool.
Why most AI coding tool comparisons are useless
The standard comparison format goes like this: a developer spends a week with each tool, rates the code suggestions, notes the UI quirks, and publishes a verdict. This tells you which tool feels better to use. It tells you nothing about what happens to throughput after 90 days of real production use.
The problems with that format:
- A week is not enough to see steady-state behavior. Novelty effects inflate early performance.
- Developer satisfaction scores do not correlate with throughput. Engineers can love a tool and ship no faster.
- Isolated test tasks do not capture review cycles, merge conflicts, and the friction of AI-generated code going through a real pipeline.
A fair comparison requires the same measurement instrument applied across the same type of team for the same time window. Everything else is marketing.

The measurement setup
For each tool, the data below comes from teams that ran a structured 90-day deployment with:
- A 6-week baseline period before the tool was activated, measuring merged PRs per engineer per week
- The same data source (GitHub pull request data) used for baseline and post-deployment measurement
- A minimum of 10 engineers per team to produce statistically meaningful throughput changes
- A control group of engineers not using the tool, held constant across the measurement period
The cost inputs:
- Tool licensing cost per seat per month (list price, no negotiated discounts)
- Compute pass-through costs where separately billed
- Engineering time attributed to the AI workflow, estimated at 20 to 25% of the time the AI was actively generating code
The formula is the same one described in the ROI measurement framework post: cost per merged PR equals total monthly AI tooling cost divided by merged PRs in the month.
GitHub Copilot: the enterprise baseline
Pricing: $19 per seat per month (Business plan). No separate compute charges. Usage is bundled.
What it is: GitHub Copilot operates as an IDE extension across VS Code, JetBrains, and Visual Studio. It completes code inline, suggests functions, writes tests, and answers questions in a chat interface. It integrates tightly with GitHub pull request and code review workflows.
Throughput at 90 days
Teams in the Yardstick dataset running GitHub Copilot showed throughput increases of 15 to 22% in merged PR volume at 90 days compared to their baseline period. The range is driven primarily by adoption depth: teams where more than 70% of commits touched Copilot-generated code showed results at the high end. Teams with shallow adoption clustered at the low end.
Baseline average before deployment: 12.4 merged PRs per engineer per month. Post-deployment average at 90 days: 14.3 to 15.1 merged PRs per engineer per month.
Cost per merged PR
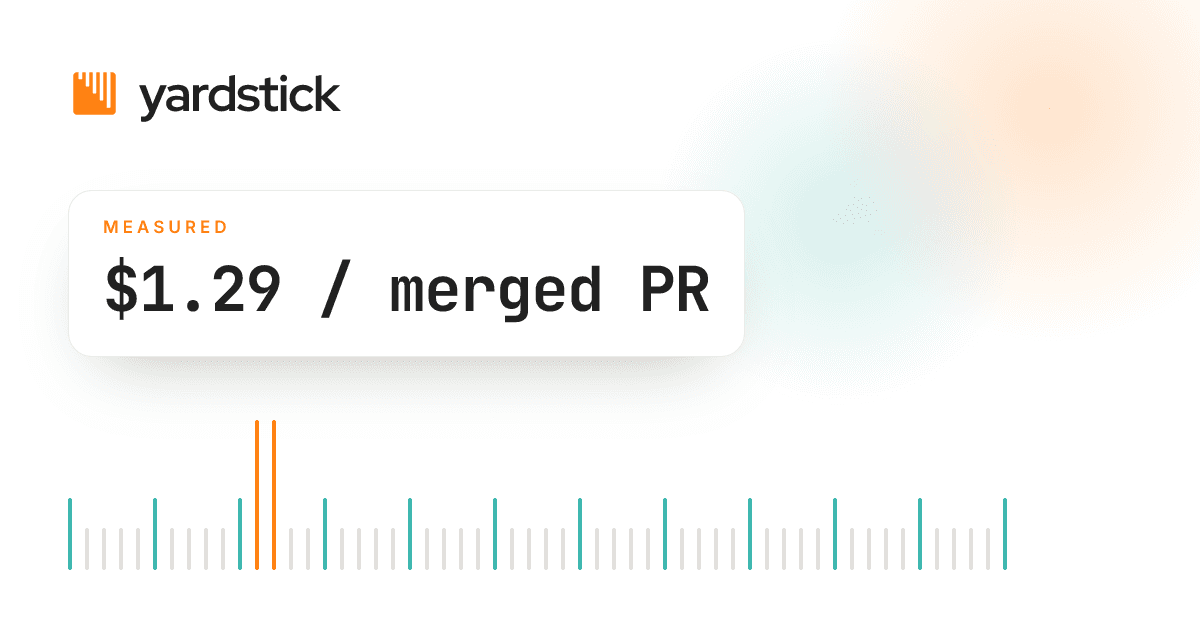
At $19 per seat per month and 14.7 merged PRs per engineer per month (midpoint), the tool-only cost per PR is $1.29.
Adding the engineering time component at 22% of active AI usage time, the realistic all-in cost per PR lands at $1.60 to $2.10, depending on how much of each engineer's day flows through the tool.
Where Copilot wins
Copilot's integration with GitHub Actions, code review, and the existing GitHub ecosystem reduces friction for teams already on GitHub. The enterprise plan includes admin controls, usage analytics, and SSO, which matters for teams with procurement and compliance requirements. The cost per PR is predictable: $19 in, reliable output out.
Where it falls short
Copilot's context window is narrower than Cursor or Claude Code for multi-file tasks. Engineers working on complex refactors or architecture-level changes report that Copilot suggestions become less relevant when the task requires holding more of the codebase in context. For greenfield projects and bounded tasks, this is not a problem. For teams with large, interconnected codebases, it shows up in the data as a ceiling on throughput gains.
Cursor Pro: the throughput leader
Pricing: $20 per seat per month (Pro plan). Includes a monthly request quota. Overage charges apply if the quota is exceeded, typically adding $5 to $15 per engineer per month for high-usage teams.
What it is: Cursor is a standalone IDE built on VS Code that embeds AI across the editing, refactoring, and debugging workflow. Its Composer feature handles multi-file edits from a single prompt. The Codebase Context feature indexes the full repository and lets the model reference it when generating suggestions.
Throughput at 90 days
Cursor teams in the Yardstick dataset showed throughput increases of 22 to 35% in merged PR volume at 90 days. The higher ceiling compared to Copilot reflects Cursor's stronger performance on multi-file tasks, which tend to be the bottleneck in teams shipping complex features.
Baseline average before deployment: 12.1 merged PRs per engineer per month. Post-deployment average at 90 days: 14.8 to 16.3 merged PRs per engineer per month.
Cost per merged PR
At $20 to $35 per seat per month (including typical overages) and 15.5 merged PRs per engineer per month (midpoint), the tool-only cost per PR is $1.29 to $2.26.
With the engineering time component, the all-in range is $1.60 to $2.80 per merged PR.
Where Cursor wins
Cursor consistently outperforms Copilot on tasks that require editing multiple files simultaneously. Teams that rely heavily on refactoring, large feature additions, or test coverage expansion tend to see larger throughput gains with Cursor. The Tab completion feature has the highest next-line prediction accuracy among the three tools tested.
Where it falls short
Cursor requires adopting a new IDE, which creates a migration cost that does not show up in the tool price. Teams on JetBrains, Vim, or other non-VS-Code environments face a steeper adoption curve. The first 30 days often show a dip before the improvement curve takes hold, which can skew 30-day checkpoint data negatively.
Overage charges also make the all-in cost less predictable than Copilot. High-output engineers on large codebases can push monthly costs to $35 to $40 per seat.

Claude Code: the complex-task specialist
Pricing: $100 per month per developer on the Claude Pro plan. API-based billing for teams using the Claude API directly, which scales with token usage and typically runs $50 to $250 per engineer per month depending on usage intensity.
What it is: Claude Code operates as an agentic coding tool that can plan, execute, and iterate on multi-step engineering tasks from the terminal or IDE. It handles tasks that require understanding intent across a large codebase, writing code across multiple files, running tests, interpreting output, and revising based on results.
Throughput at 90 days
Claude Code teams in the Yardstick dataset showed throughput increases of 28 to 42% in merged PR volume at 90 days. The wide range reflects the steeper learning curve: teams that invest in adapting their workflow to Claude Code for complex tasks see significantly better results than teams that use it the same way they would use Copilot.
Baseline average before deployment: 11.8 merged PRs per engineer per month. Post-deployment average at 90 days: 15.1 to 16.7 merged PRs per engineer per month.
Cost per merged PR
At $100 per seat per month (Pro plan) and 15.9 merged PRs per engineer per month (midpoint), the tool-only cost per PR is $6.29.
This is the highest tool-only cost per PR among the three. The picture changes when output scope is factored in. Claude Code-generated PRs tend to be larger, covering more files per merge. Teams that measure lines of meaningful code per PR rather than raw PR count report a different cost-per-output story. But on raw PR volume, the tool-only cost is higher.
With the engineering time component, the all-in range is $7.00 to $9.50 per merged PR on the Pro plan. Teams on API billing that ship 30 or more merged PRs per engineer per month can bring the all-in cost per PR down to $5.00 to $6.00.
Where Claude Code wins
Claude Code is the strongest of the three for tasks that require planning and multi-step execution: building new features from a spec, refactoring across a large module, or writing comprehensive test suites from scratch. Teams using Claude Code for these high-complexity tasks often report that it replaces work that would have taken a senior engineer several hours. The throughput gain in those cases is larger than raw PR volume captures.
Where it falls short
The $100 per month Pro plan price is five times the cost of Copilot or Cursor. For teams where AI agents are primarily handling bounded, repetitive tasks, the cost structure does not justify itself on a cost-per-PR basis. Claude Code is the right choice when the output per task is high enough to make the per-task cost acceptable.
The learning curve also affects early results more than the other two tools. Teams that do not invest in workflow adaptation in the first 30 days often see disappointing 30-day numbers before realizing the full 90-day potential.
Side by side: cost per merged PR at 90 days
| Tool | Monthly cost per seat | PRs per engineer per month (90d) | Tool-only cost per PR | All-in cost per PR |
|---|---|---|---|---|
| GitHub Copilot | $19 | 14.7 | $1.29 | $1.60 to $2.10 |
| Cursor Pro | $20 to $35 | 15.5 | $1.29 to $2.26 | $1.60 to $2.80 |
| Claude Code (Pro) | $100 | 15.9 | $6.29 | $7.00 to $9.50 |
Pro Tip: These are tool-only costs. To get your real cost per merged PR, add the fully loaded engineering time in the AI workflow. If engineers spend 20% of their AI-active time reviewing and editing AI output, multiply that by the hourly rate and add it to the tool cost before dividing by PR count.
What actually drives the variance
The numbers above are medians. The real range in each bucket is significant, and the spread comes from four variables that have nothing to do with the tools themselves.
Adoption depth. The single biggest driver of throughput outcomes. Teams where fewer than 50% of commits touch AI-generated code see half the throughput gains of teams where the tool is embedded in every engineer's daily workflow. Adoption depth is a team management problem, not a tool problem.
PR size discipline. AI coding tools produce better results on bounded, well-defined tasks. Teams that break work into smaller PRs see larger throughput gains than teams that batch large changes. This is a workflow habit that compounds or limits the tool's impact.
Code review speed. All three tools improve the speed of writing code. None of them improve the speed of reviewing it. Teams where review is the bottleneck see smaller throughput gains because the backlog builds at the review stage regardless of how fast the code was written. If your median PR spends more than two days in review, fix that before measuring AI ROI.
Codebase maturity. All three tools perform better on green-field code and established patterns than on large legacy codebases with poor test coverage. The more the model has to navigate undocumented or inconsistently structured code, the more human correction the output requires.
How to run your own comparison
If you are running multiple tools in parallel or considering a switch, the comparison is only meaningful if you control for these variables.
- Use the same engineers for each tool, or matched cohorts. Do not compare a senior team on Copilot to a junior team on Cursor.
- Run each tool for a minimum of 60 days. The first 30 days often reflect learning curves, not steady-state performance.
- Measure from GitHub, not from surveys. Merged PR counts and lead times from version control are auditable. Developer satisfaction surveys are not.
- Calculate cost per PR with the same formula. Tool cost plus compute plus engineering time overhead, divided by merged PRs. Keep the formula constant across both tools.
- Document what changed besides the tool. A sprint where a senior engineer joined the team, a codebase cleanup, or a shift to smaller PRs can all inflate results independently of the AI tool.

Key Takeaways
- Copilot and Cursor converge on cost per PR at the tool-only level ($1.29 midpoint for both). The difference shows up in throughput ceiling: Cursor outperforms on complex multi-file work.
- Claude Code costs more per PR on raw volume metrics but handles higher-complexity output per merge. The right question is not which tool is cheapest but which tool matches the complexity of your team's actual work.
- The biggest cost-per-PR lever is not tool choice. It is adoption depth. A team at 70% adoption depth on Copilot outperforms a team at 30% adoption on Claude Code.
- Evaluate at 90 days, not 30. Novelty effects and learning curves make 30-day data unreliable for budget decisions.
- The tool comparison is secondary to the measurement infrastructure. Teams that can show finance a cost-per-PR number that dropped have a defensible budget argument regardless of which tool is on the invoice.
Why the tool choice matters less than the measurement
The practical difference between Copilot and Cursor on cost per merged PR is under a dollar. The difference between using AI tools with structured measurement and using them without it is the difference between a defensible ROI number and a vendor presentation you cannot reproduce.
Teams that will win the internal argument for AI tooling spend are not the ones that picked the right tool. They are the ones that set a baseline, held a control group, measured at 90 days, and showed finance a cost per merged PR that dropped. That argument works regardless of which tool is on the invoice.
- Vukasin
How Yardstick tracks cost per PR across tools
Yardstick connects AI coding agent activity to GitHub pull request data automatically, calculates cost per merged PR using your actual licensing and compute costs, and displays the results in a unified dashboard whether your team is running one tool or three in parallel.
For teams evaluating a tool switch or running a structured pilot, Yardstick generates a 90-day scorecard that shows cost per PR, throughput delta, and lead time change in a format finance can verify.
To join the early access list or see the platform, visit yardstick.fi/platform or review pricing for current plan options.
FAQ
Which AI coding tool is best for enterprise teams?
GitHub Copilot is the lowest-friction enterprise option due to its GitHub integration, admin controls, and predictable pricing. Cursor Pro produces higher throughput gains for teams willing to adopt a new IDE. Claude Code is the strongest for complex multi-file tasks but carries the highest cost per PR on raw volume metrics.
Is Claude Code worth the $100 per month cost?
It depends on what engineers are using it for. For complex feature development, refactoring, and test coverage work, the throughput gains often justify the cost. For teams using it primarily for autocomplete on simple tasks, the cost per PR is difficult to justify when Copilot and Cursor deliver similar throughput at a fraction of the price.
How long does it take to see ROI from AI coding tools?
Based on Yardstick pilot data, meaningful throughput changes show up at 60 days. The steady-state number worth taking to finance appears at 90 days. Evaluating at 30 days consistently produces optimistic numbers that do not hold.
Can you run multiple AI coding tools in parallel?
Yes, and many teams do. The measurement challenge is attribution: if engineers are switching between Copilot and Cursor, it is difficult to isolate the contribution of each. The cleanest comparison assigns specific engineers to specific tools and holds that assignment constant for the measurement period.
What is a realistic cost per merged PR for a 100-person engineering team?
At 100 engineers on Cursor Pro with 15.5 PRs per engineer per month, total monthly tool cost runs $2,000 to $3,500, and total merged PR volume runs 1,550 per month. Tool-only cost per PR: $1.29 to $2.26. All-in cost per PR with engineering time: $1.80 to $3.00.
Recommended

Leads commercial and go-to-market. Founder of Emberwood, an AI-driven cold-email agency for B2B, with a background in outbound, lead generation, and sales.