Why your AI coding pilot looked great at 30 days and failed by 90
The 30-day checkpoint is where most AI coding pilots get their budget renewed. It is also the point most likely to show you a number that will not survive contact with reality.
The 30-day checkpoint is when most AI coding pilots get their budget renewed. The numbers look good. Engineers are happy. Productivity graphs are going up and to the right. Leadership signs off on the full rollout.
Then something happens between week 6 and week 12.
The throughput gains soften. Code review queues grow back. Some engineers stop using the tool for anything complex. The CFO asks for an updated number at the six-month mark, and you do not have one you can stand behind.
This is not a tool problem. It is a measurement window problem.
Why every AI coding pilot looks good at 30 days
The 30-day checkpoint captures three phenomena that have nothing to do with steady-state performance.
Novelty-driven engagement. Engineers are measurably more productive when they are learning a new tool. The act of exploration itself produces output. When teams deploy a new AI coding agent internally, the engineers with the highest early usage numbers are almost always the ones most excited about the technology. Six months later, the usage distribution looks completely different. Early adopters are still using it. Everyone else has returned to their previous patterns.
Self-selection bias in early adoption. The engineers who volunteer for an AI coding pilot are not a representative sample of your team. They are the ones most comfortable with new tools, most likely to adapt their workflow, and most optimistic about the outcome. Their 30-day results tell you what is possible for that specific group. They do not tell you what will happen when you roll the tool out to the median engineer on your team.
Task cherry-picking. At 30 days, engineers have learned roughly where the tool helps and where it frustrates them. Naturally, they gravitate toward tasks where the AI output is reliable and avoid the ones where it is not. This makes early numbers look better than they are because the task mix is not representative of normal work. At 90 days, engineers have to use the tool on everything, including the messy legacy code and the ambiguous feature specs.
The measurement error compounds all three. If you are measuring 30-day results from the beginning of tool activation, you are capturing the engineers who adopt fastest, on the tasks they find easiest, during a period of peak motivation. The number will not reproduce.
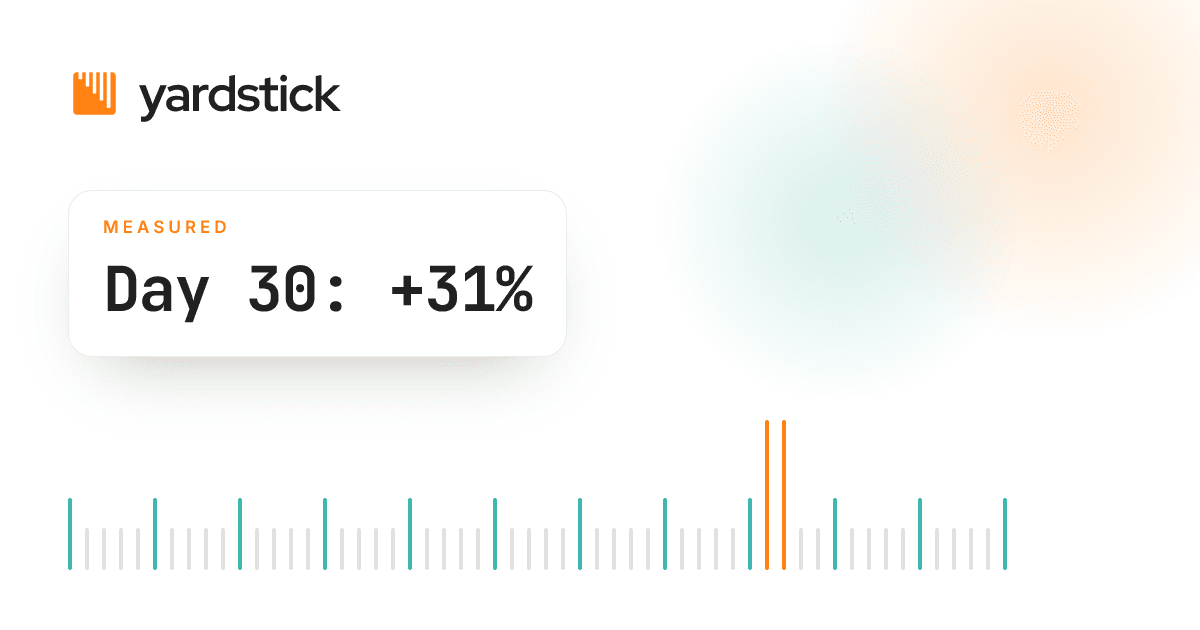
In the Yardstick pilot dataset, the average throughput improvement reported at the 30-day checkpoint across AI coding deployments was 31%. The 90-day steady-state number for the same teams averaged 17%. That gap is not measurement error. It is pilot inflation.

What actually happens between day 30 and day 90
There are four mechanisms that reliably compress early gains during the second and third month of an AI coding deployment.
Adoption depth drops. The initial spike in AI-generated code commits does not hold. Engineers use the tool heavily for the first few weeks, then find their actual working pattern. For most teams, this means a smaller fraction of commits touching AI output than the first-month numbers suggested. If your measurement framework defined adoption as "has the tool installed," you are not tracking the right variable. Adoption depth, the percentage of commits where the engineer meaningfully used AI output, is the number that predicts 90-day results.
The code review bottleneck surfaces. AI coding tools produce code faster. They do not produce a faster code review process. By week six, most teams find that the PR queue is growing because engineers are generating more code than reviewers can process. The throughput improvement in merged PRs stops scaling because the constraint has shifted from writing to reviewing. Teams that resolve this, either by adding review capacity or by tightening PR scope, continue to improve. Teams that do not see their numbers plateau.
AI-generated code debt accumulates. The first wave of AI output tends to be reviewed carefully because the tool is new and engineers are cautious. By month two, review patterns have normalized, and some AI-generated code moves through the pipeline with less scrutiny. This creates technical debt that is harder to detect because it looks syntactically correct. The consequences show up as increased review cycles, more rollback incidents, or growing bug density in AI-touched files. None of these show up in 30-day pilot data because the debt has not had time to surface.
Metric gaming starts. Once engineers understand what is being measured, they start optimizing for the metric. If the pilot tracks merged PR volume, engineers start breaking work into smaller PRs to inflate the count. If it tracks lines of code, AI usage goes up and review quality goes down. This is not malicious. It is the natural human response to any measurement system. The 30-day number predates this adaptation. The 90-day number reflects it.
Which metrics survive 90 days
Not all measurement approaches are equally vulnerable to pilot inflation. Some hold up. Others are almost guaranteed to mislead.
Cost per merged PR holds, with conditions. If you establish a six-week baseline before the tool is active, use a consistent formula across the measurement period, and maintain a control group of engineers not using the tool, cost per merged PR at 90 days is the most reliable single metric for budget decisions. The measurement framework post covers how to calculate this correctly. The key caveat is that PR scope discipline matters. If the pilot triggers a change in how engineers size their PRs, the denominator changes and the metric becomes hard to interpret.
Lead time from commit to merge is stable and hard to game. It is also harder to move than raw throughput. Teams where AI tools improve lead time by 15% or more at 90 days have a real result because lead time reflects the full pipeline including review, not just code generation speed.
Metrics that do not survive to a reliable 90-day read:
-
AI suggestion acceptance rate. This measures how often engineers click accept on AI completions. At 30 days, acceptance rates are high because engineers are exploring. At 90 days, engineers have calibrated their threshold and acceptance rates are lower but more meaningful. The early number tells you almost nothing about value delivered.
-
Developer satisfaction surveys. Satisfaction with a new tool at 30 days is nearly always positive. The novelty effect dominates. At 90 days, satisfaction reflects actual utility. These surveys are useful data at 90 days and mostly noise at 30.
-
Lines of code per day. This is the fastest metric to game and the least correlated with actual output quality. It should not be in your pilot measurement framework regardless of time horizon.

How to structure a pilot so the 90-day number means something
If you are about to start an AI coding pilot, or if you are currently in one with measurement you do not trust, here is the structure that produces a 90-day number finance can verify.
Step 1: Establish a baseline before the tool is live. Six weeks of data from your existing workflow, using the same data source you will use post-deployment, is the minimum. The baseline needs to cover the same engineers who will be in the pilot. Without a pre-deployment baseline, you have no before-number to compare against, and your only claim is that things changed, not by how much.
Step 2: Define the metric before day one. The metric has to be chosen before the pilot starts, not after you see the results. Choosing a metric that shows a positive result after the fact is not measurement. It is rationalization. Write down the single number you will use to evaluate success, the threshold that would constitute a pass or fail, and who gets to see it before the pilot ends.
Step 3: Create a control group. Some engineers do not use the tool during the pilot period. They are not a punishment group. They are the variable you hold constant so you can isolate what the tool actually contributed. Without a control group, any throughput change you observe could be explained by a change in sprint scope, a new engineer joining the team, or a shift to simpler work.
Step 4: Commit to the 90-day window before the pilot starts. If leadership can call the pilot at 30 days based on early numbers, the incentive to produce good-looking early numbers becomes very strong. The 90-day commitment has to be explicit and agreed to before day one. The 30-day checkpoint should be a health check, not a decision point.
Step 5: Do not announce exactly what you are measuring. Engineers who know their PR volume is being tracked will optimize PR volume. Engineers who do not know what is being tracked will work normally, and the data will be cleaner. If individual-level transparency is a requirement in your organization, measure at the team level instead. Team-level measurement is harder to game because it requires collective coordination.
The CFO conversation at day 90
The engineering leaders I talk to who handle the budget conversation well have one thing in common. They decided the metric before the rollout. Not the best-looking metric after the fact, not the metric the vendor recommended in their ROI calculator, but the metric they would have used if the answer turned out to be negative.
That conversation goes like this: here is our baseline PR throughput from the six weeks before deployment. Here is our 90-day number from the same engineers on the same measurement. The tool cost is X. Cost per merged PR dropped from Y to Z. That is the number.
It does not require a deck. It does not require vendor quotes or analyst reports. It requires a baseline, a consistent formula, and 90 days of patience.
The teams that do not have that conversation are the ones who ran a 30-day pilot, showed leadership the inflated early numbers, got the budget approved, and then quietly stopped measuring when the numbers normalized. They have the tool, they have the cost, and they have no defensible answer when finance asks what they are getting for it.
Key Takeaways
- 30-day pilot numbers overstate 90-day reality by an average of 1.8x in Yardstick pilot data. This is not a tool failure. It is a measurement window problem.
- Four mechanisms drive pilot inflation: novelty-driven engagement, self-selection bias in early adoption, task cherry-picking, and metric gaming. Every pilot experiences all four to some degree.
- Cost per merged PR at 90 days is the most defensible single metric for budget decisions, provided it is calculated from a pre-deployment baseline with a consistent formula and a control group. See the full calculation method here.
- The 30-day checkpoint should be a health check, not a decision point. Checking adoption depth, control group integrity, and early anomalies at 30 days is appropriate. Making a go or no-go budget decision at 30 days is not.
- The CFO conversation is easier if you structured the pilot correctly from day one. The difficulty of that conversation is inversely proportional to the quality of your measurement setup.
Why the 90-day commitment is the hardest part
Engineering teams operate under quarterly pressure. Pilots that cannot show results within a quarter get canceled. That pressure creates strong incentives to declare success at 30 days and move on.
The organizations that build durable AI ROI cases do not resist this pressure by ignoring it. They manage it by setting expectations differently from the start: the first 30 days confirm that adoption is happening. Day 30 to 60 is when the learning curve normalizes. Day 60 to 90 is when steady-state performance emerges. The decision is made at 90.
That framing holds up in practice because it reflects what actually happens. And it produces a number at 90 days that is worth more to the organization than a number at 30 days that turns out not to hold.
- Vukasin
How Yardstick tracks the 30-to-90 transition
Yardstick connects AI coding agent activity to GitHub pull request data and displays cost per merged PR on a rolling basis, so you can see how the number evolves over time rather than taking a single snapshot.
For teams running structured pilots, Yardstick generates a 90-day scorecard comparing the pilot cohort against the control group, with baseline, mid-point, and endpoint numbers in a single view that finance can audit.
To join the early access list or see the platform, visit yardstick.fi/platform or review pricing for current plan options.
FAQ
Why do AI coding pilots always look better at 30 days than 90?
Three mechanisms compound: novelty-driven engagement inflates early usage, self-selection bias means early adopters are not representative of the full team, and task cherry-picking directs AI usage toward work where it helps most. At 90 days, normal work patterns return and all three effects normalize.
What is a reliable measurement window for AI coding tools?
Ninety days from tool activation, measured against a six-week baseline established before the tool was live. Sixty days produces usable data but is more vulnerable to lingering novelty effects. Thirty days is not a reliable basis for a budget decision.
How much do 30-day AI coding metrics overstate real performance?
In Yardstick pilot data, 30-day throughput improvements average 31% and 90-day steady-state improvements average 17% for the same teams. The ratio varies by team, tool, and adoption depth, but 30-day numbers consistently overstate 90-day results by 1.5x to 2x.
What should a 30-day checkpoint actually measure?
Adoption depth (what percentage of commits are touching AI output), control group integrity (confirming the non-AI cohort is holding constant), and anomaly detection (anything that might contaminate the measurement, such as a team structure change or a sprint format shift). It should not be the basis for a go or no-go decision on the tool.
What happens if the 90-day number is negative?
It happens. Teams with low adoption depth, a code review bottleneck that was not resolved, or a codebase architecture that the tool handles poorly will see flat or negative results at 90 days. A negative 90-day number is valuable information. It tells you whether the problem is the tool, the workflow, or the deployment strategy, and it gives you that information before you commit to a long-term contract.
Recommended

Leads commercial and go-to-market. Founder of Emberwood, an AI-driven cold-email agency for B2B, with a background in outbound, lead generation, and sales.